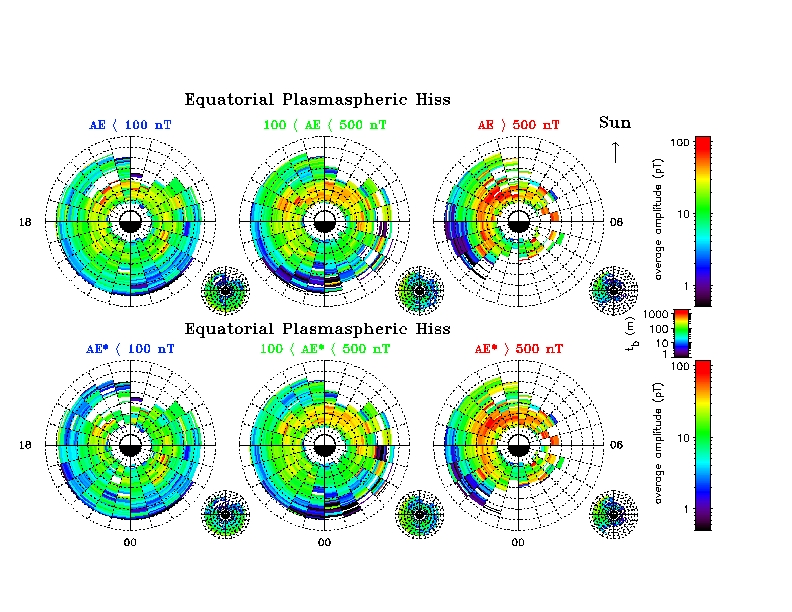
| Figure 3. The average equatorial hiss magnetic field wave amplitude as a function of L and MLT for different levels of substorm activity based on the instantaneous value of the AE index (upper panels) and AE* (lower panels). The corresponding sampling distributions, colour-coded to show the number of minutes in each bin, tb(m), are shown in the small panels. |
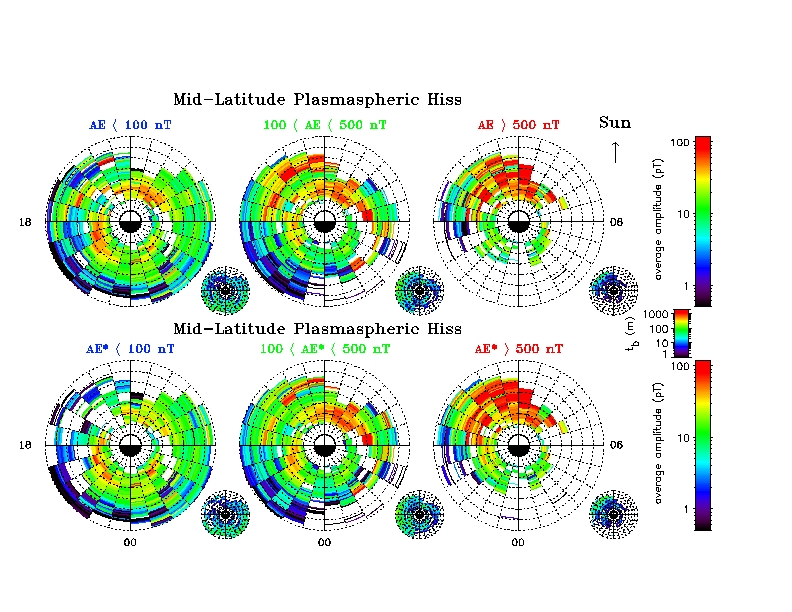
| Figure 4. The average mid-latitude hiss magnetic field wave amplitude as a function of L, MLT and substorm activity in the same format as Figure 3. |
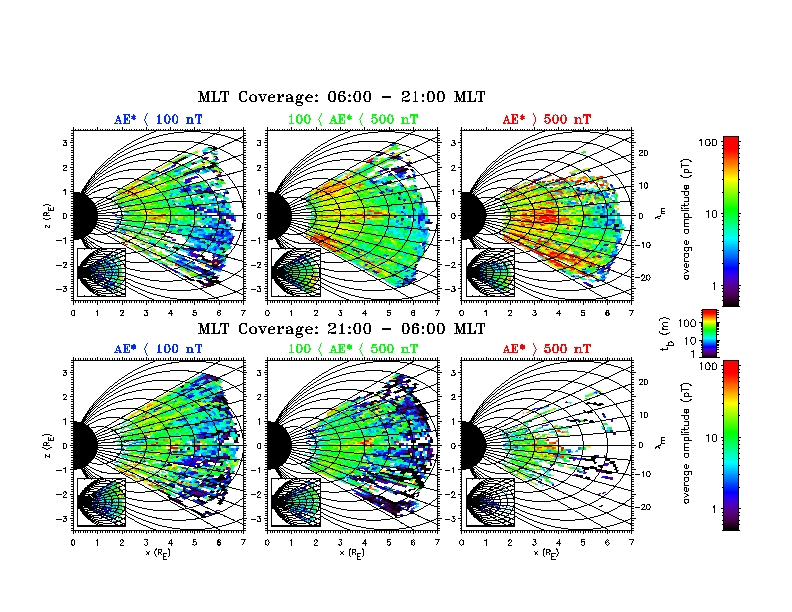
| Figure 5. The average radial and latitudinal distribution of plasmaspheric hiss magnetic field wave amplitude as a function of AE* for 0600-2100 MLT (upper panels) and 2100-0600 MLT (lower panels). |